We believe that voting communicates our views and helps to influence corporate practices, with the ultimate goal of positively influencing how a company is run in the long term. We take voting seriously and aim to vote on all of the annual general meetings of our holdings by making informed and independent voting decisions, applying due care, diligence, and judgment across the entire portfolio.
We write analysis reports on each company proxy voting instruction explaining the rationale behind our votes. We also have a quarterly internal monitoring process lead by the Head of Compliance, reporting on whether our votes are in line with our Voting Policy. Please find our 2023 Annual Voting Report here.
Voting Statistics
Summary of 2022 vote statistics by quarter
| Summary Statistics | Q1 2023 | Q2 2023 | Q3 2023 | Q4 2023 | Total 2023 |
| Total number of meetings where it was possible to vote | 4 | 27 | 1 | 2 | 34 |
| Number of meetings in which TSI voted | 4 | 27 | 1 | 2 | 34 |
| Number of meetings in which TSI voted (as a percentage) | 100% | 100% | 100% | 100% | 100% |
| Number of management resolutions in which TSI voted | 78 | 412 | 7 | 24 | 521 |
| Number of management resolutions in which TSI voted against | 4 | 85 | 3 | 3 | 95 |
| Number of management resolutions in which TSI voted against (as a percentage) | 5% | 21% | 43% | 13% | 18% |
| Number of shareholder resolutions in which TSI voted | 1 | 33 | 2 | 0 | 36 |
| Number of shareholder resolutions in which TSI voted against | 0 | 16 | 0 | 0 | 16 |
| Number of shareholder resolutions in which TSI voted against (as a percentage) | - | 48% | - | - | 44% |
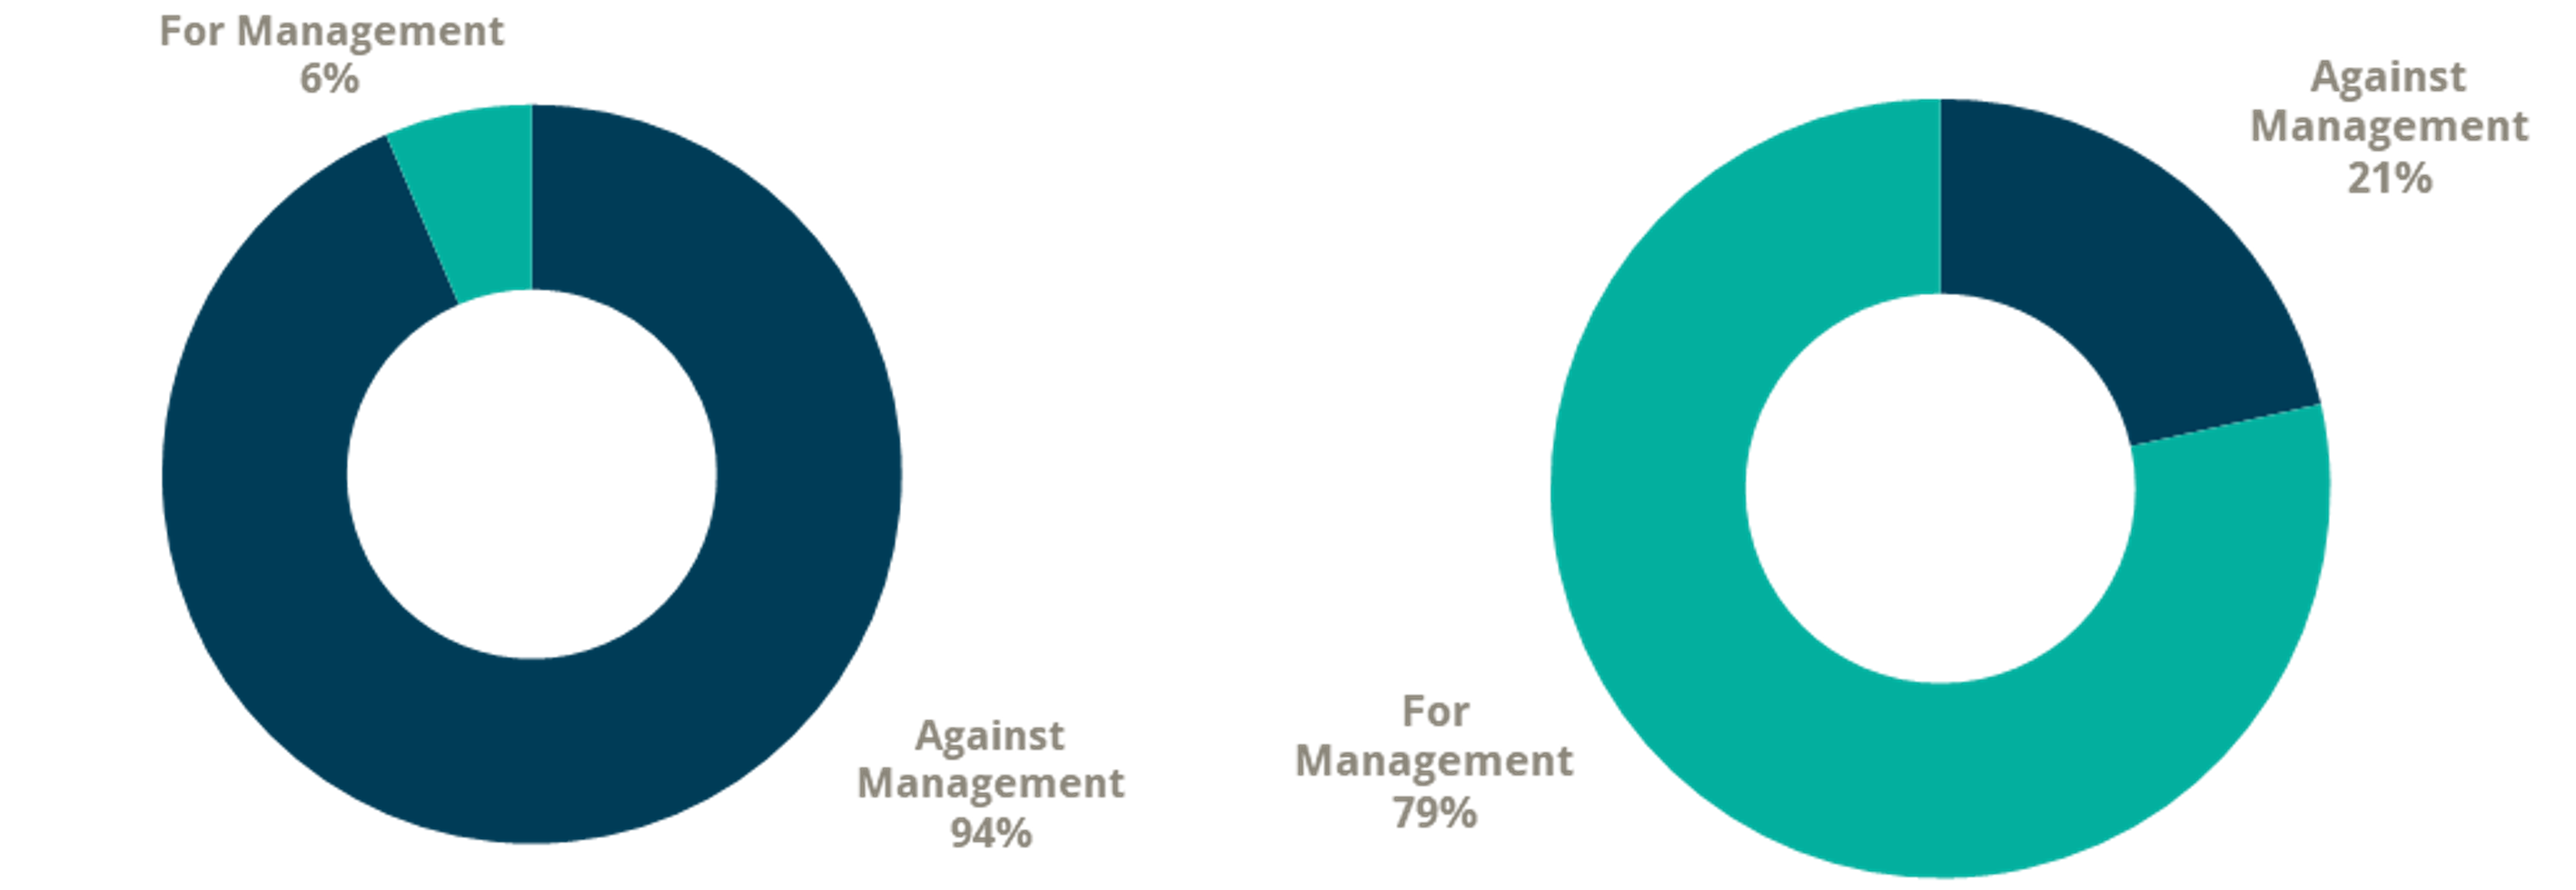
Alignment with Management
Votes against management in at least 1 proposal: Votes against management (all proposals): 
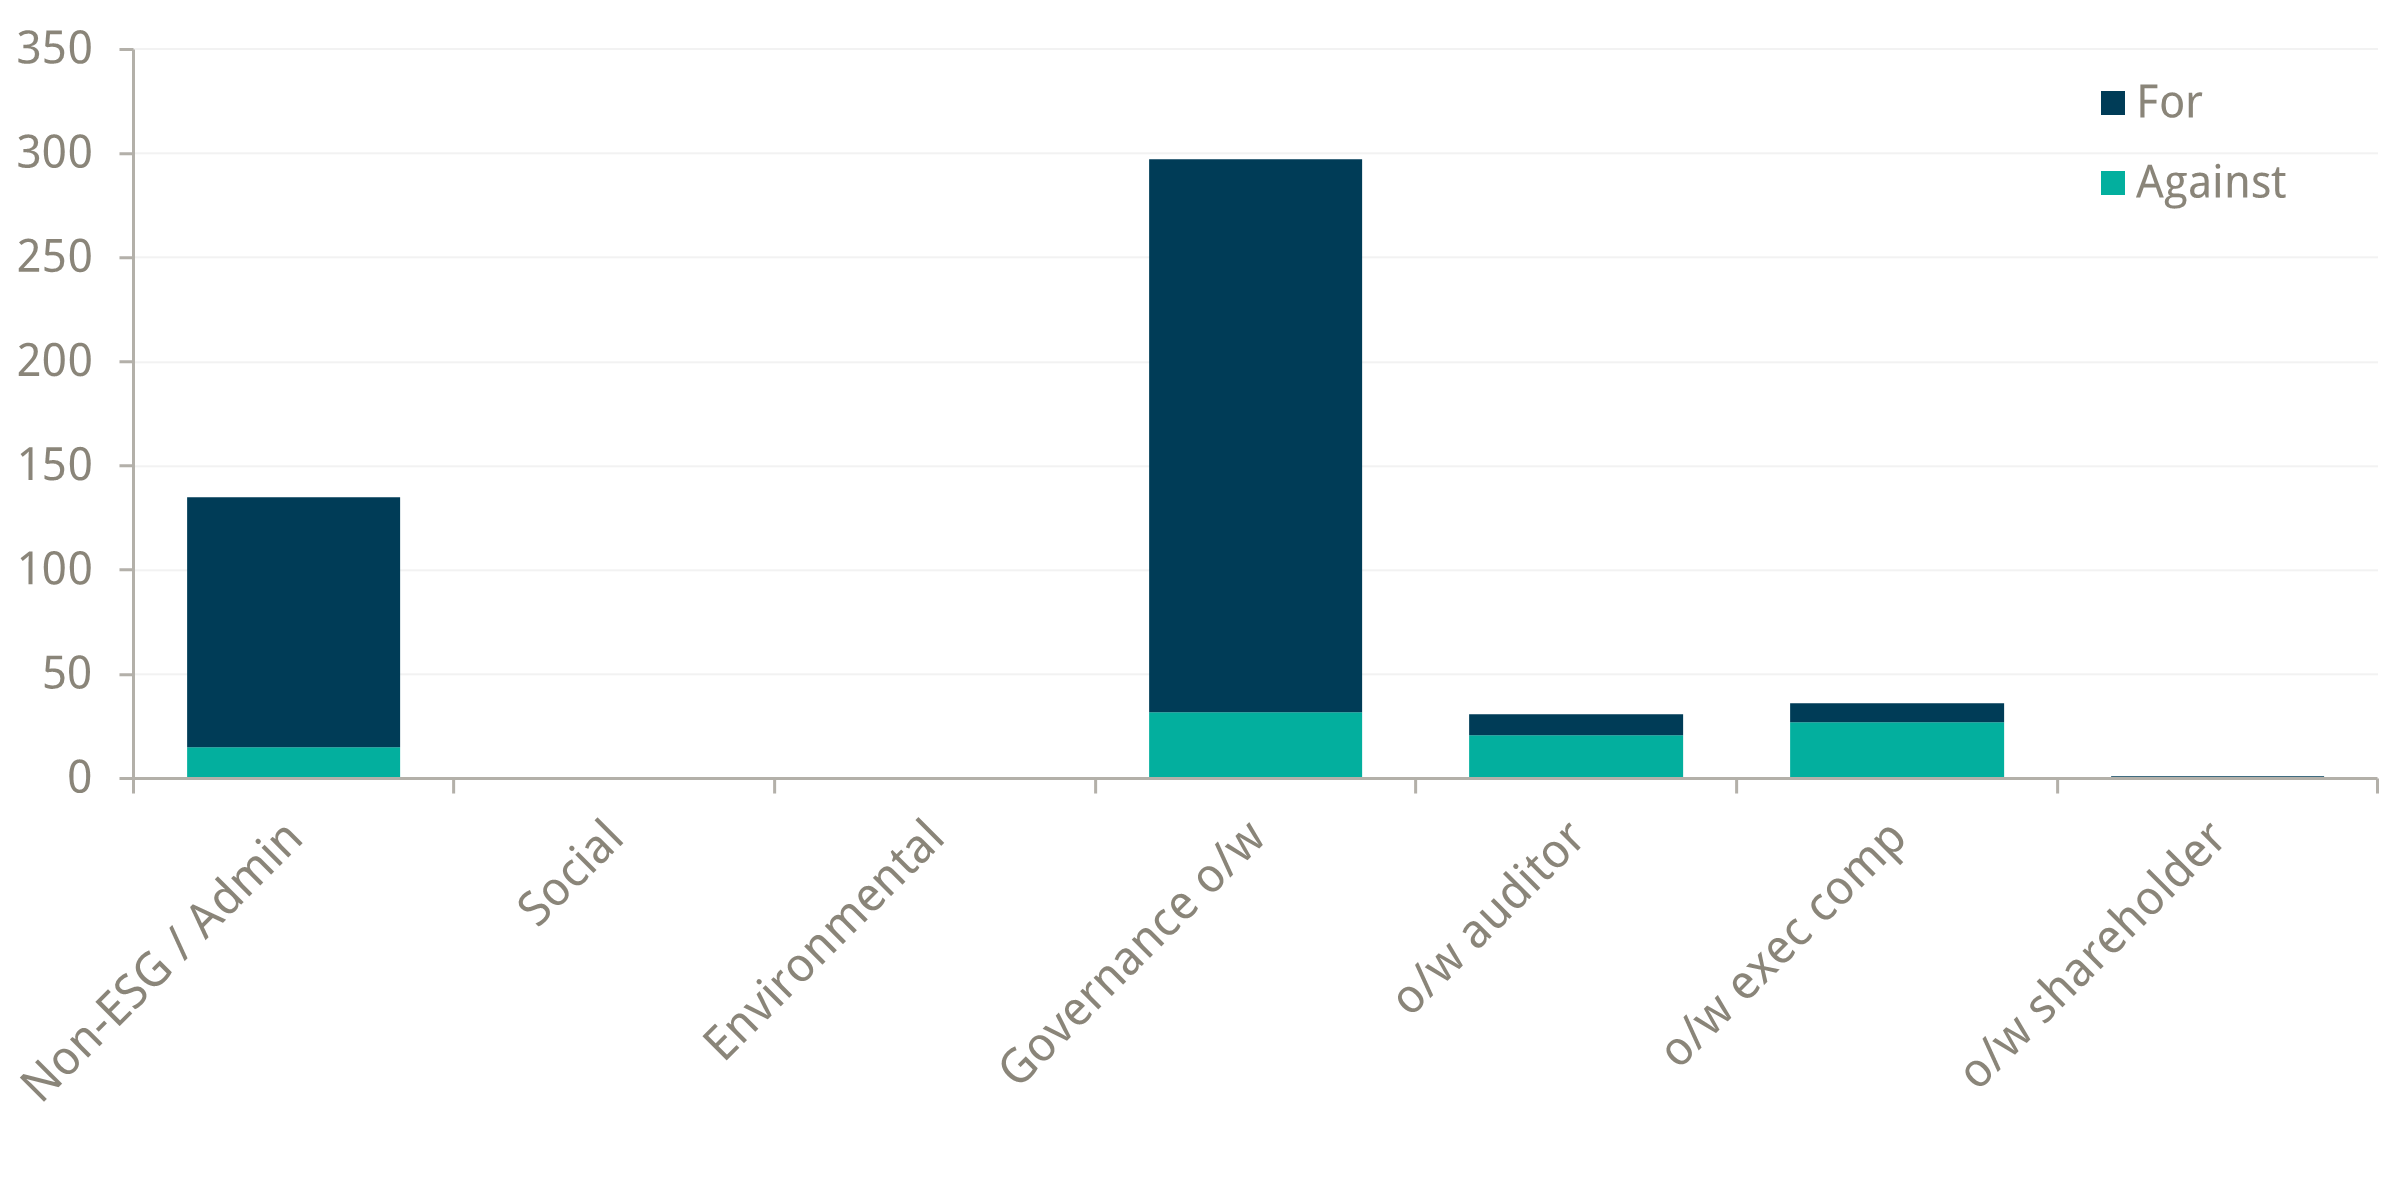
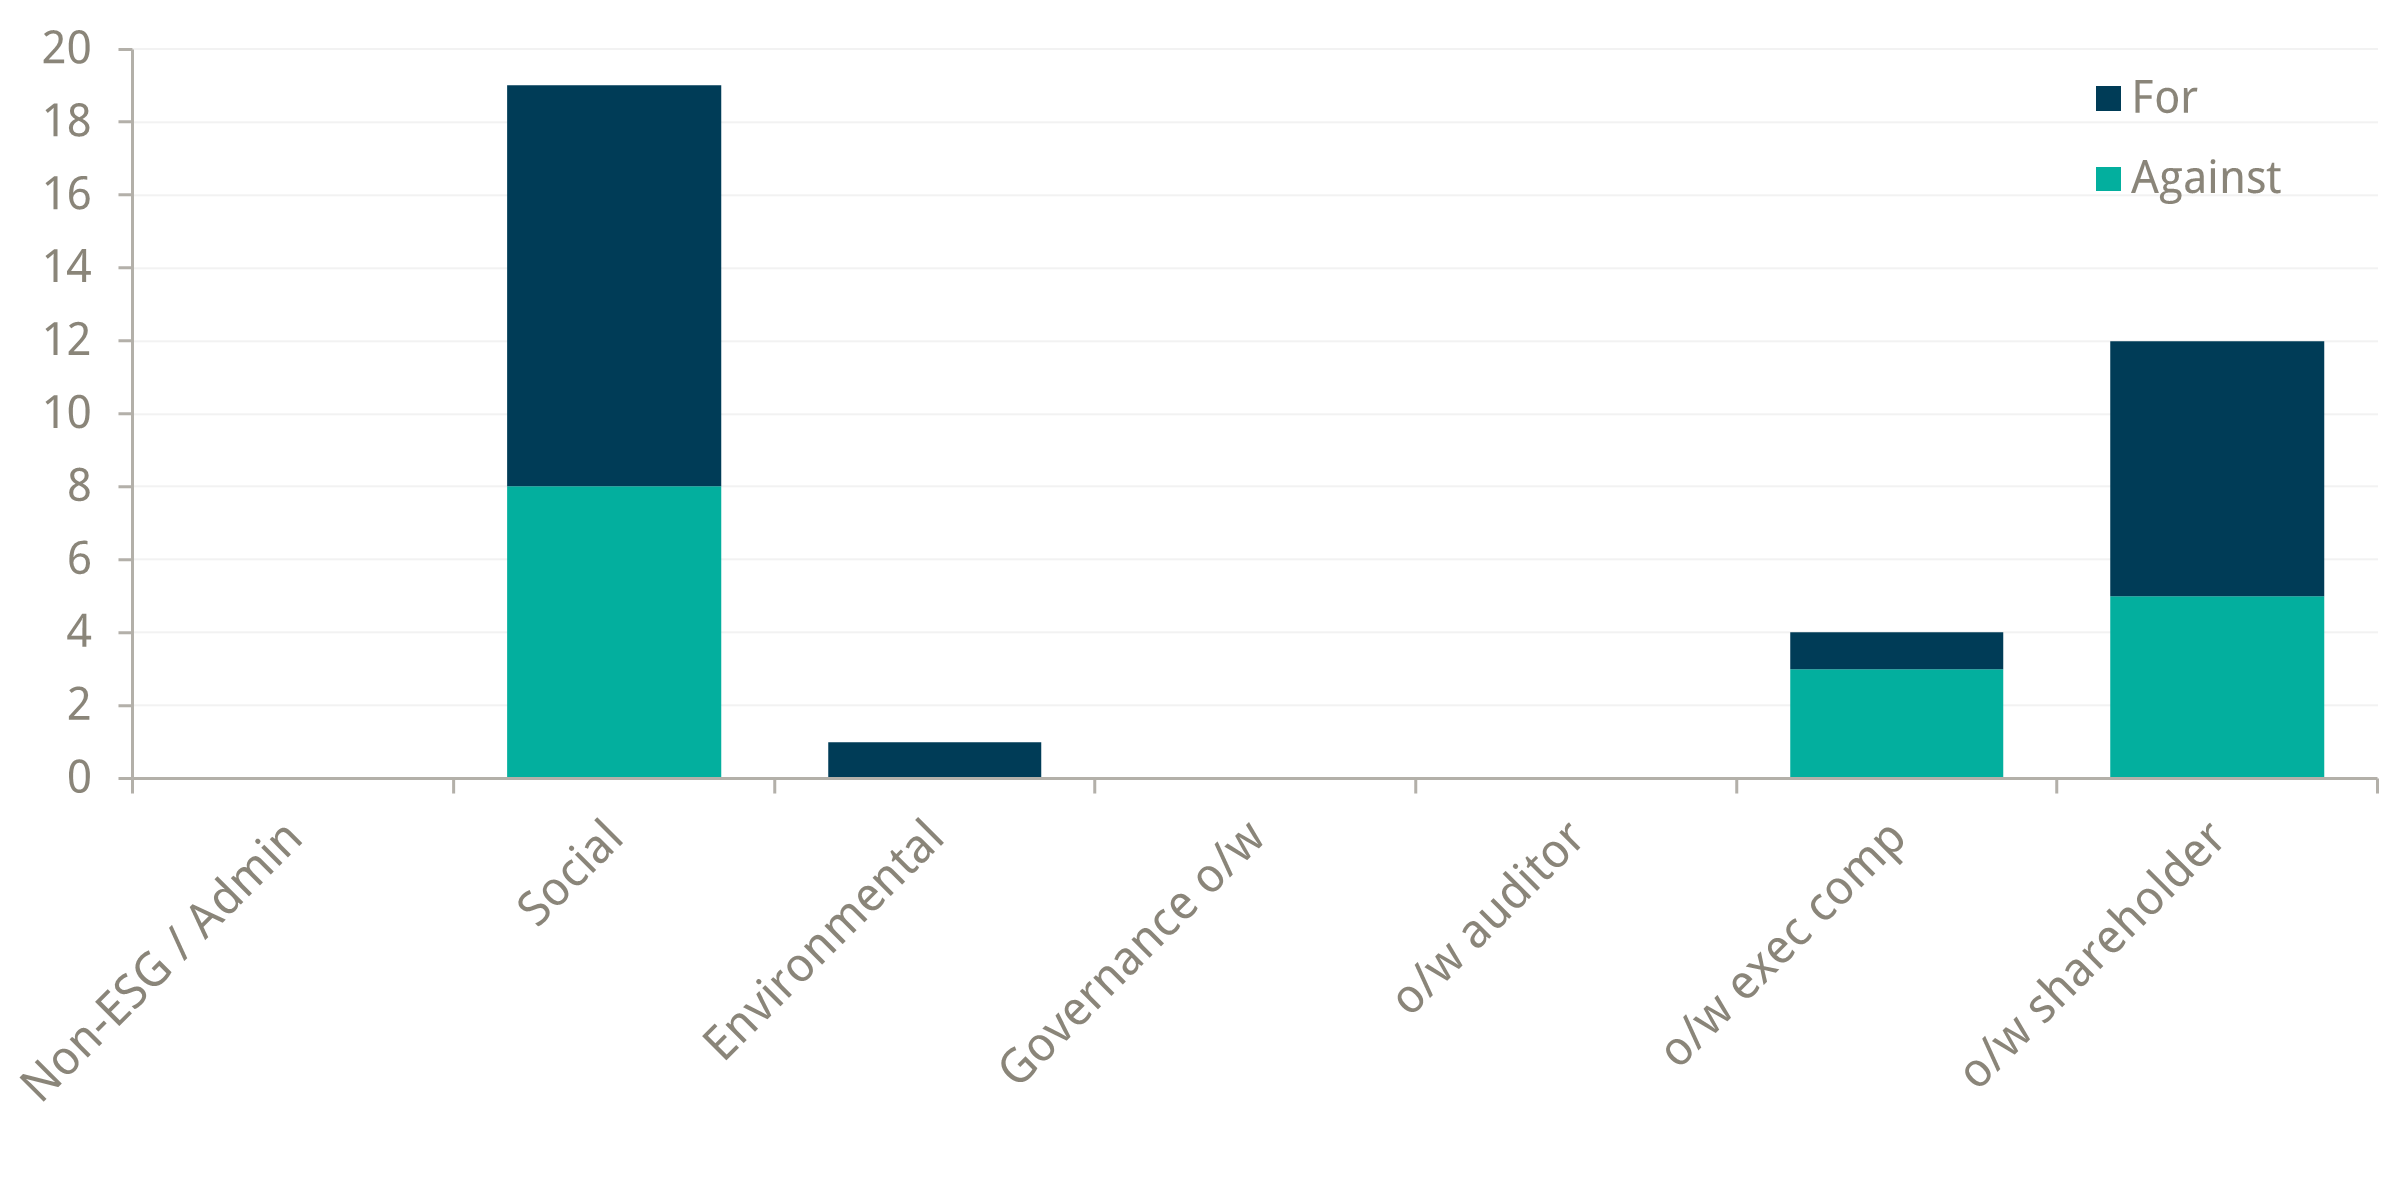
Votes by proposal type
Management proposals:
Shareholder proposals showing number of votes in each category:
For a copy of our 2022 Voting Report please click here.

